
Case Study: Competence Center for Forest and Wood 4.0
Year
2021
Location
Arsnberg, Germany
Deployment Size
100+ devices

The creation of the forest sensing network falls within the scope of the Competence Center Forest and Wood 4.0 (KWH 4.0), spearheaded by our partner the RIF Institute for Research and Transfer e.V .
Problem statement
To tackle the complexity of the modern forest industry, the KWH 4.0 seeks to apply the concepts of Industry 4.0 and the Internet of Things to the forest and wood industry cluster, providing the expertise and infrastructure needed to develop and demonstrate a Forest and Wood 4.0 vision.
Supporting the development of new technologies and processing, KWH 4.0 seeks to better assess the effectiveness of various management practices and encourage sustainable land stewardship.
Approach
To support these aims, we worked together with RIF to define a protocol for the deployment. This included, for example:
- Number and types of devices,
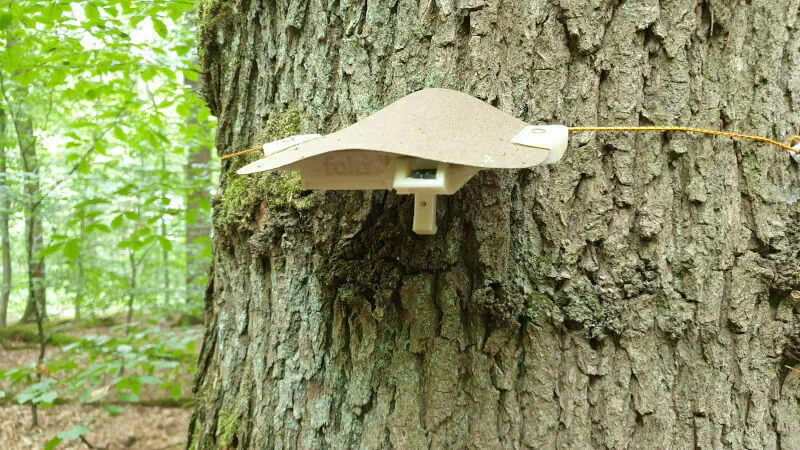
- Their physical placement in the forest and on the tree,
- The set of sensing dimensions to capture,
- How often to capture data, for each sensing dimension.
Solution

Given the deployment protocol we devised together with RIF, we tailored our hardware and software to support the requirements of this project.
As a result, we deployed 180 devices in 20 forest sites, spread over an area of >100km² around Arnsberg, each device sensing its local environment and sending us >20 different indices every hour, measuring parameters of light, air, soil, growth and biodiversity. The monitored stands encompass a wide variety of tree species, management methodologies and forest health conditions.
Results
Here we select a small portion of data from 3 salient sites in the deployment, to showcase the capabilities of the system developed within this project.
| Site | Age | Conditions | Composition | Enviroment |
|---|---|---|---|---|
| Highway site | Very young (16y) | Very Degraded | Half Douglas Fir, the rest split between Birch and Spruce | On the side of a highway |
| Lake site | Young (49y) | Degraded | Mostly Silver Fir | On a hill facing a lake |
| Wild site | Old (176y) | Healthy | Pedunculate Oak, Beech | Hearth of the forest |
Air conditions
In terms of air conditions, we collected temperature, humidity and wind speed. The latter is a derived measure, which highly correlates with wind speed as recorded from a local weather station. It is however still at the experimental stage, pending wider validation. We included it in this case study to illustrate potential.
Soil conditions
The project also required monitoring soil conditions. For this reason, we integrated soil sensors in our device, and collected soil temperature and moisture information.
Light conditions
Light spectrum data, as well as overall quantity of light going through the canopy, is an important source of information on the state of a stand. Here we summarize the collected data as an overall lux measurement.
Biodiversity
For this project, we also analyzed the forest soundscape, collecting audio data and processing it on the device itself to extract important bioacoustic indices. These are a key source of information on the overall state of biodiversity (or lack thereof) in the forest.
Here we report the Acoustic Complexity Index (ACI), Normalized Difference Soundscape Index (NDSI), and Max dB:
- ACI: an index capturing how varied and intricate the sounds are in an environment.
- NDSI: compares the balance between natural and human-made sounds in an environment. If there’s a lot of nature-made noise and little human-made noise, the NDSI value will be positive; if there’s a lot of human-made noise and little nature-made noise, the value will be negative.
- Max dB: simply put, this keeps track of how loud the environment is in general.
Summary
The full dataset collected during the course of this project offers ample opportunities for all kinds of analysis.
However, within the scope of this write-up and as a simple showcase of capabilities, we limit ourselves to a very small slice of the collected data, performing only the most superficial analysis which still highlights some interesting differences between the 3 selected sites. In this spirit, here we report the mean and standard deviation for the data reported above:
| Highway site | Lake site | Wild site | |
|---|---|---|---|
| Daily mean soil temperature (C) | 7.92±0.39 | 8.09±0.34 | 7.29±0.29 |
| Daily mean soil moisture (%) | 10.21±1 | 3.60±0.5 | 3.76±0.5 |
| Daily mean air temperature (C) | 5.57±1.71 | 5.60±1.39 | 5.10±1.64 |
| Daily mean air humidity (%) | 99.25±1.21 | 99.17±1.30 | 99.58±0.95 |
| Daily predicted mean wind speed (mph) | 3.55±1.32 | 4.82±0.98 | 1.51±1.09 |
| Hour of day mean light (Lux) | 5.01±6.89 | 4.14±5.88 | 2.67±3.60 |
| Hour of day mean Biodiv. NDSI | -0.34±0.21 | 0.08±0.11 | 0.06±0.13 |
| Hour of day mean Biodiv. ACI | 4.87±0.06 | 4.84±0.05 | 4.90±0.07 |
| Hour of day mean dB max | -63.78±2.95 | -65.85±2.15 | -65.48±2.01 |
For the selected time period:
- the wild site has a prevalence of bio sound, and with higher acoustic complexity. Under the tree cover, sensors here receive less light on average, the air has higher humidity and temperature variance is low, with lower wind speeds.
- the lake site is the quietest site and is on average windier than the other two sites. It is otherwise middle-of-the pack in all other considered dimensions, between the other two sites.
- the highway site is on average the noisiest, with a prevalence of anthropic sounds, and lowest acoustic complexity. Here the devices tend to receive more light through the canopy, the soil and air temperatures tend to have higher excursions, and the soil moisture is constantly higher.